Multidimensional Income Mobility:
an Introduction
Brett Mullins
Fiscal Research Center
7/20/2017
Overview
- Mobility for Matrices
- Mobility for Arrays
- The Case of Noisy Data
- Develop Multidimensional Index
- Empirical Example: SNAP Enrollment
Mobility for Matrices
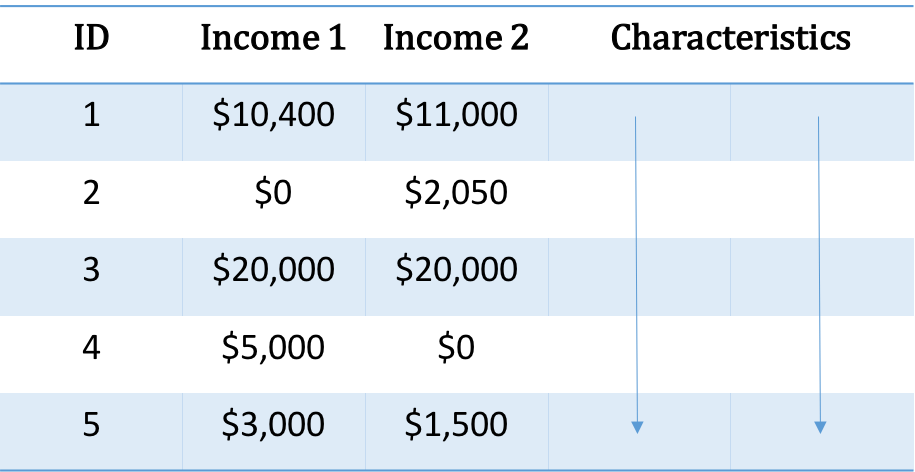
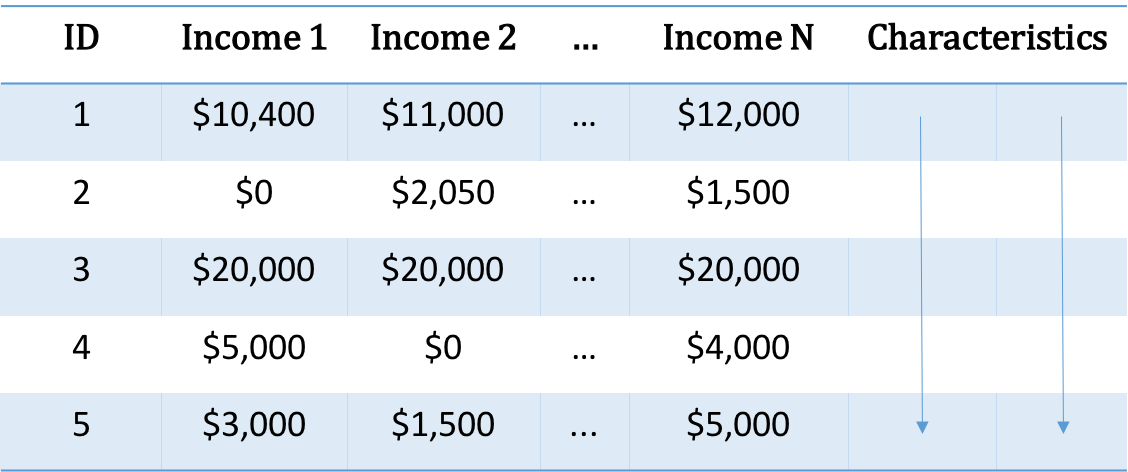
Contingency Tables
- The primative representation of data for mobility
- These data illustrate the single period case
Contingency Tables
- The primative representation of data for mobility
- These data illustrate the single period case
- We may discretize income either into bins of a fixed width or into quantiles
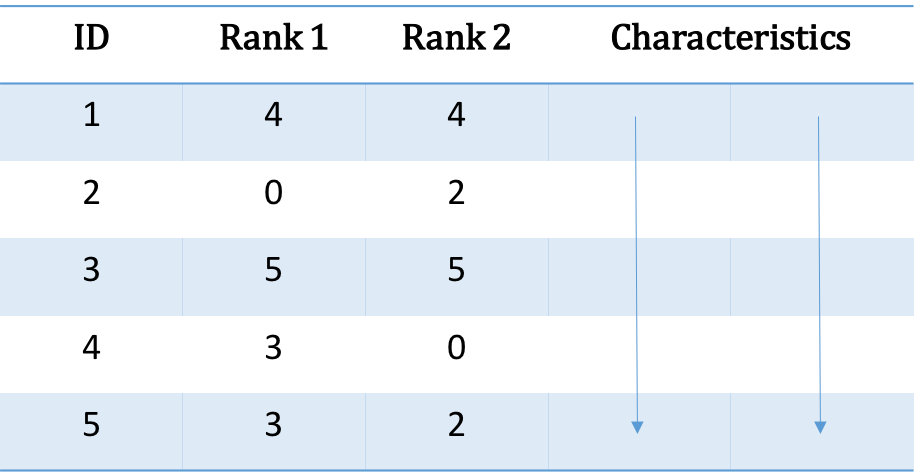
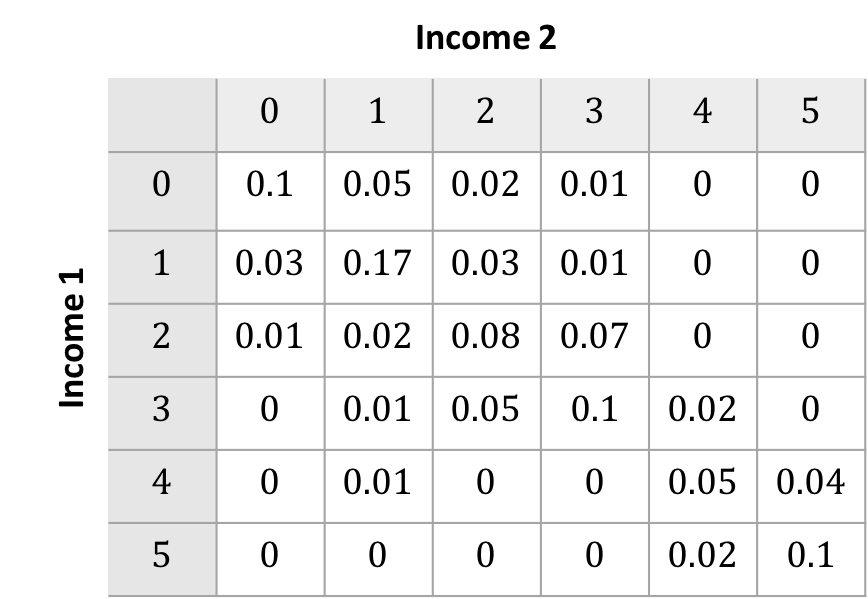
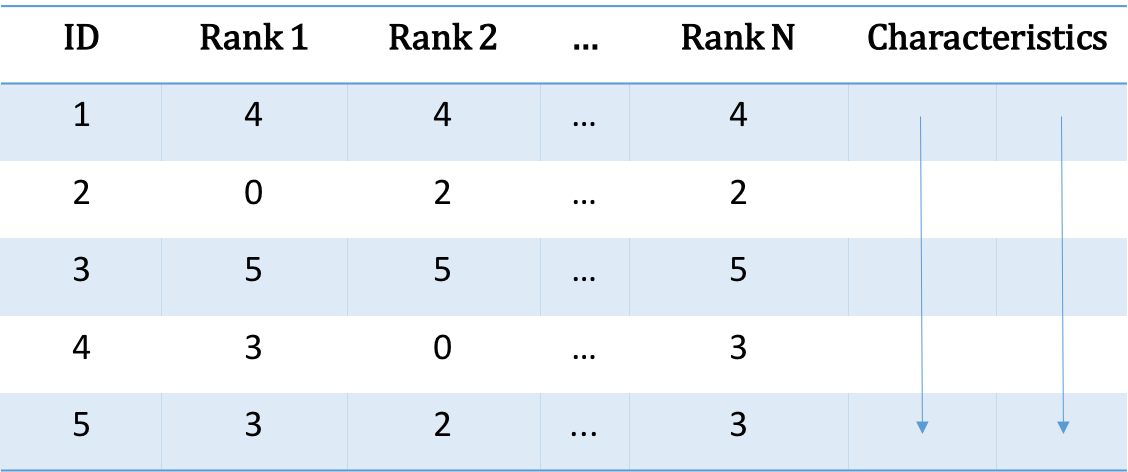
Transition Matrices
- Construct the count matrix by binning observations to the cartesian product of the ranks
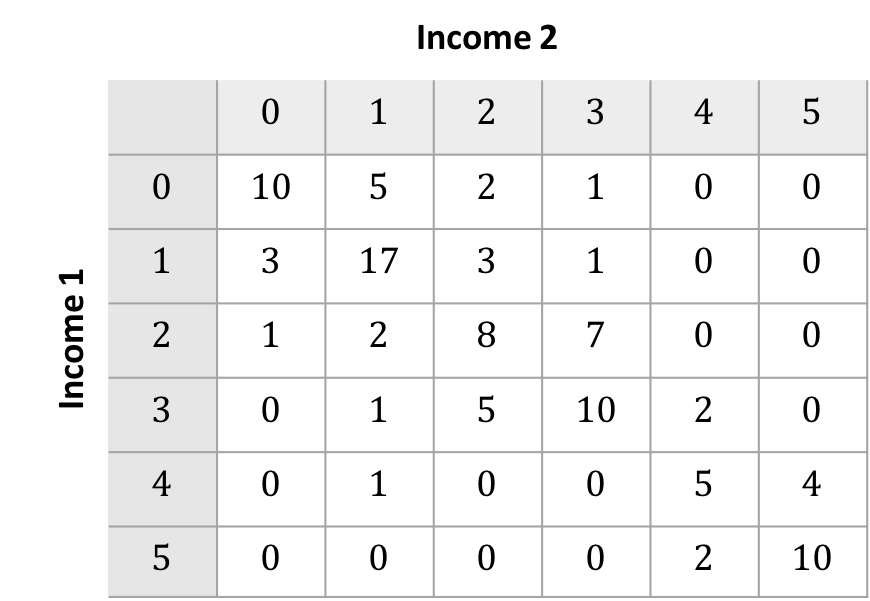
Transition Matrices
- Construct the count matrix by binning observations to the cartesian product of the ranks
- Construct the unconditional transition matrix $M_u$ by dividing each cell by the total observations
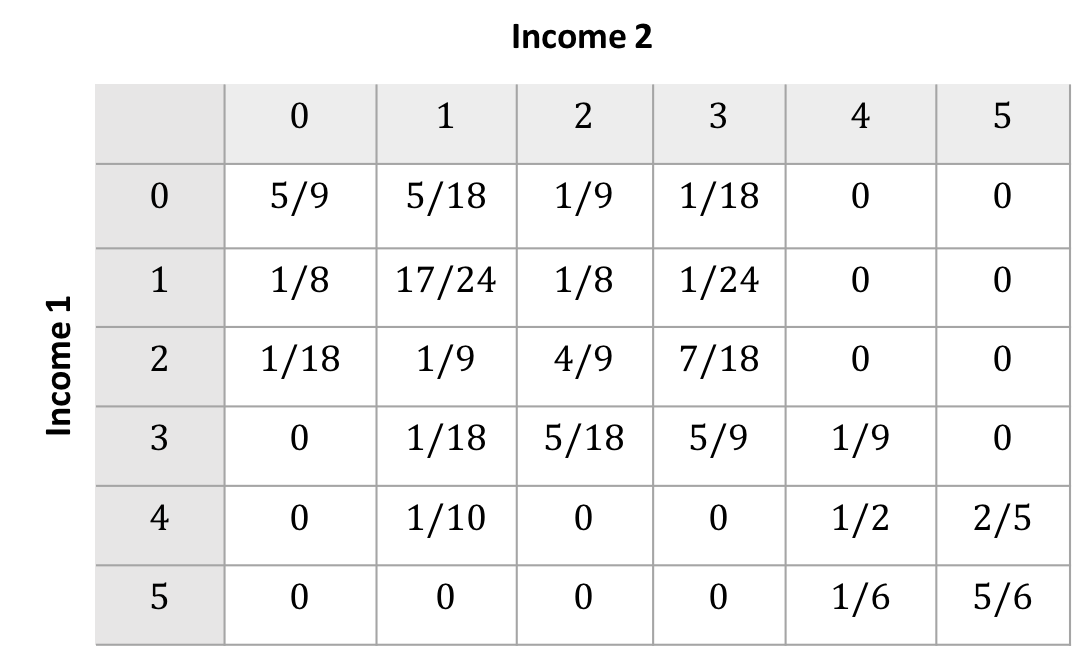
Transition Matrices
- Construct the count matrix by binning observations to the cartesian product of the ranks
- Construct the unconditional transition matrix $M_u$ by dividing each cell by the total observations
- Alternatively, the conditional transition matrix $M_c$ can be used to take advantage of stochatic properties
Mobility Indices
A mobility index is a function $m : \mathcal{M} \rightarrow \mathbb{R} $ that captures some facet of mobility for the samplewhere $\mathcal{M}$ is the set of all transition matrices of a fixed size
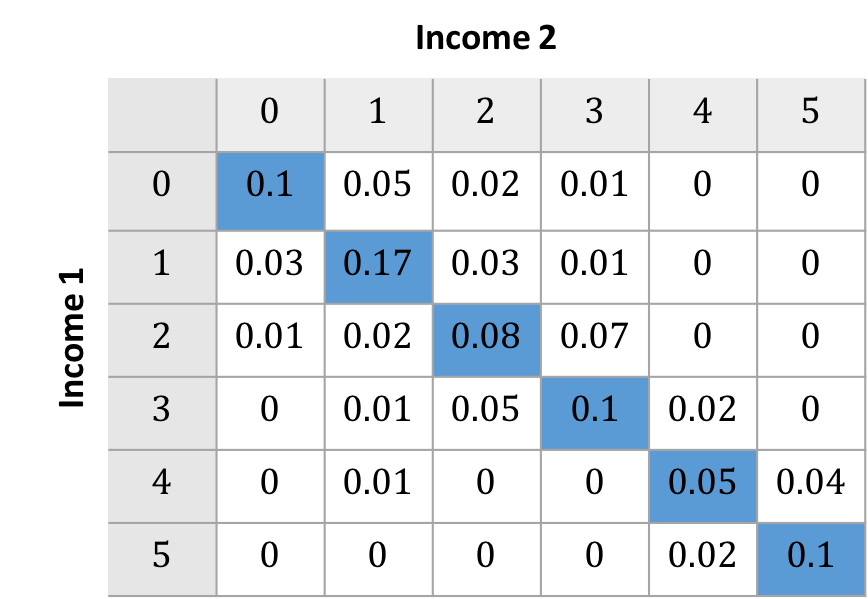
Prais-Bibby Index
- Let $n$ denote the number of ranks
- $m_{PB}(M_c) = \left( \sum_{i = 1}^N (1 - M_{cii})\sum_{j = 1}^N M_{uij} \right)$
- Captures the probability that one moves from their initial rank
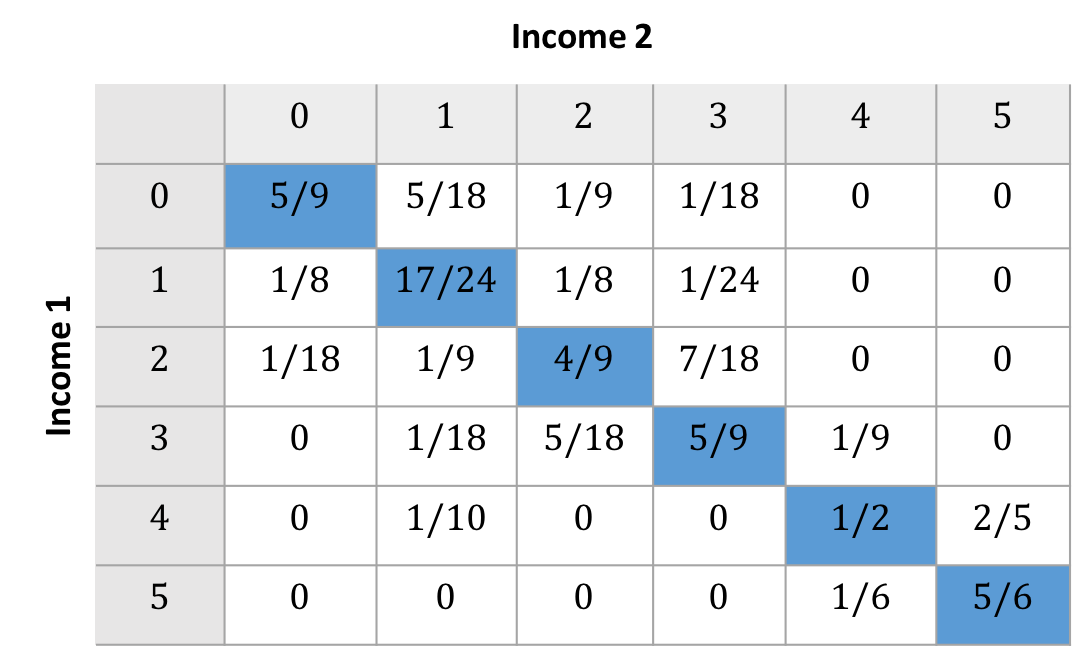
$m_{PB}(M_c) = 0.4$
Prais-Bibby Index
- Let $n$ denote the number of ranks
- $m_{PB}(M_c) = \left( \sum_{i = 1}^N (1 - M_{cii})\sum_{j = 1}^N M_{uij} \right)$
- Captures the probability that one moves from their initial rank
- Equivalent to one minus the sum of the diagonal of $M_u$
$m_{PB}(M_c) = 0.4$
Mobility Indices
- $m_{PB}$ is an individualistic discrete index
- An index is individualistic if each individual in the same makes a marginal contribution to the index
- An index is discrete if it measures whether an individual experienced mobility rather than the magnitude of the mobility
Mobility for Arrays
Contingency Tables
Contingency Tables
Multidimensional Arrays
- Analgous stucture to a transition matrix
- For $N = 3$, the array can be visualized as a cube
- Follows process of computing the count array, unconditional transition array, and conditional transition array
Indices for Multidimensional Arrays
- We can generalize the Prais-Bibby Index to arbitrary arrays as follows: let $m_{PB}:\mathcal{A} \rightarrow \mathbb{R}$, where $\mathcal{A}$ is the set of square transition arrays
- The function is defined as before where the trace or diagonal of the array is the set of cells that each share the same index on each dimension
- Interpretation: one does not experience mobility if one is in the same rank at each observed time
The Case of Noisy Data
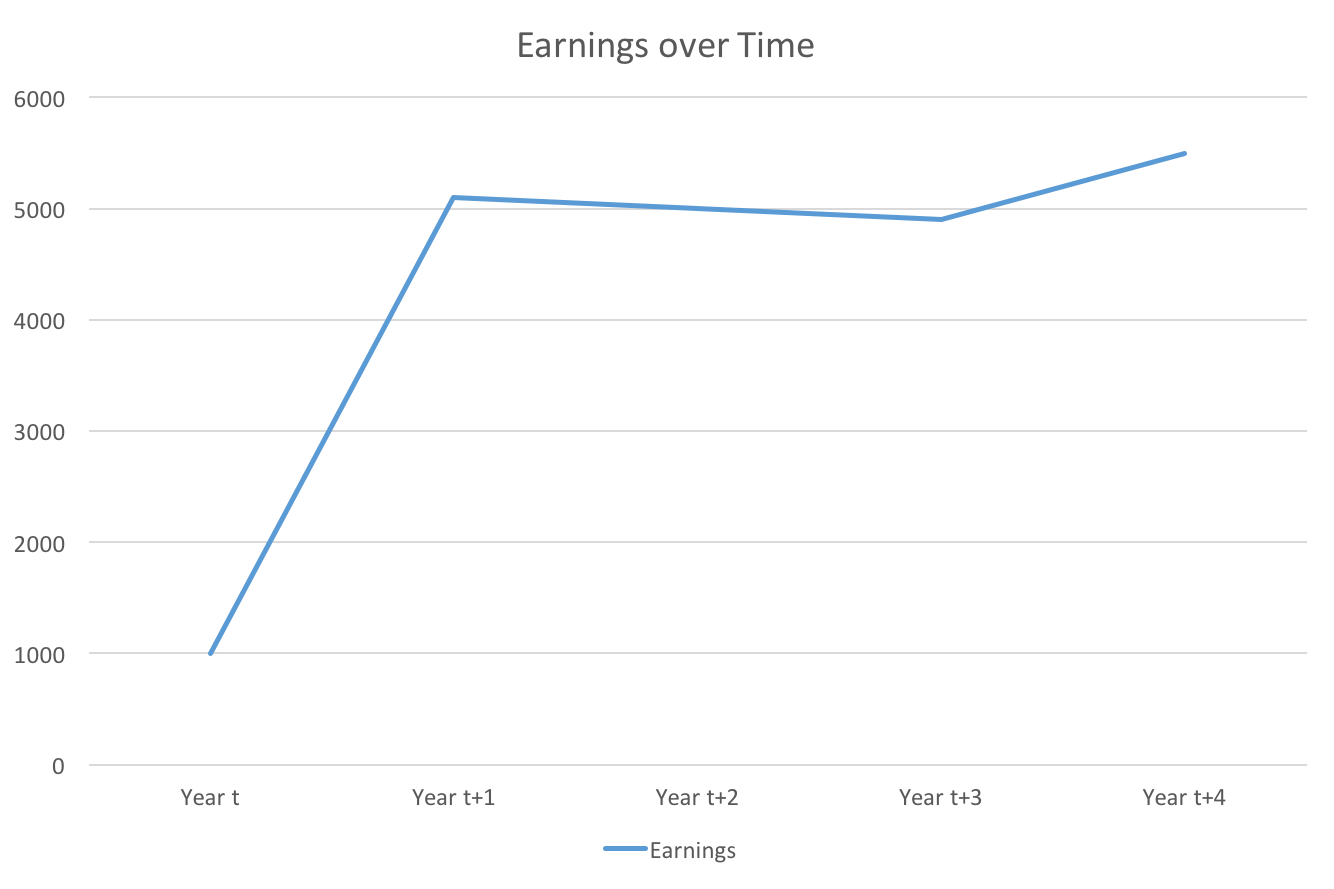
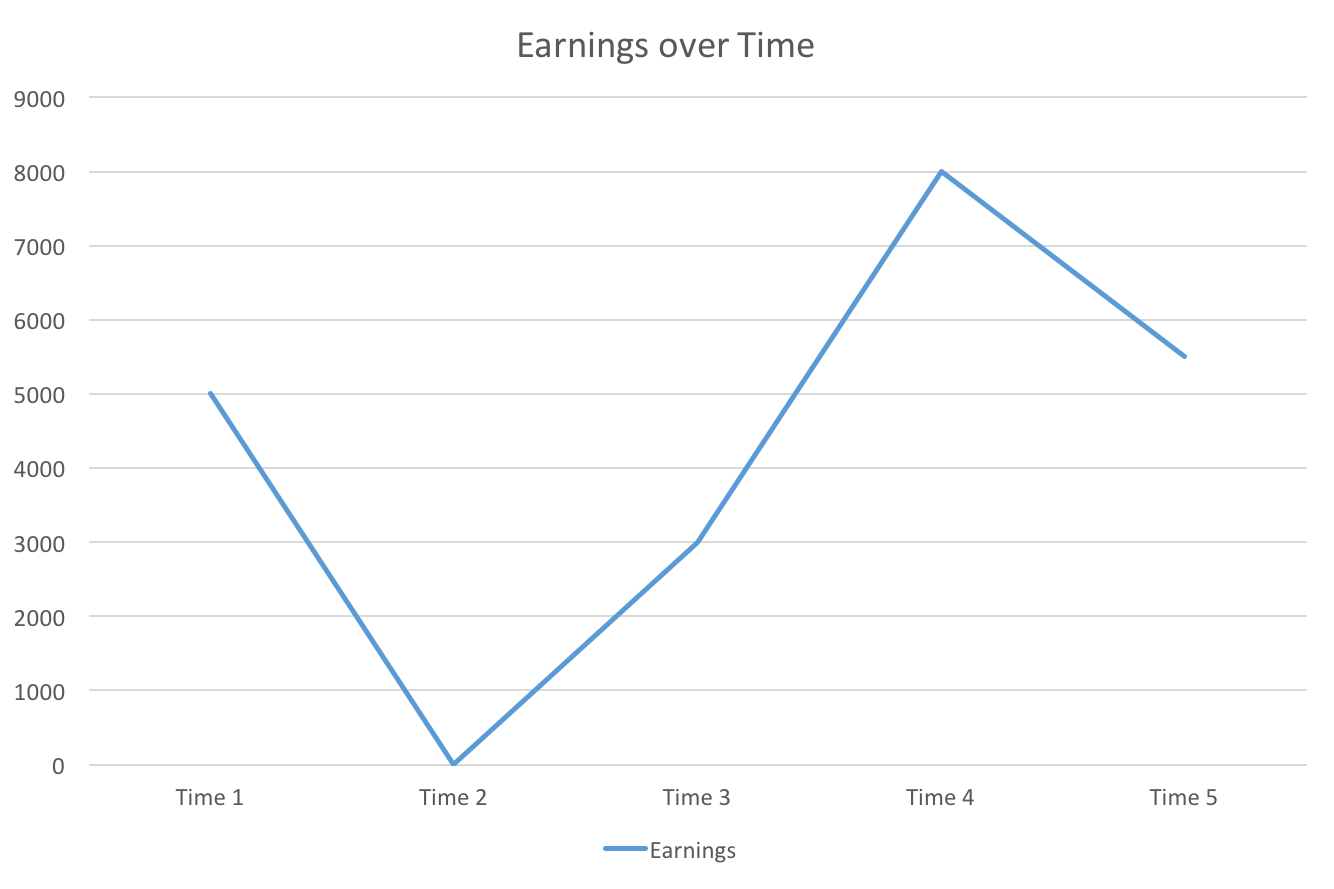
Noisy Data
- Suppose income (earnings) is observed at Time 1 and Time 5
- No mobility
- Since individuals are not isolated, they face exogenous impacts to their income
- Will this methodology lead to correct classification and wider inference to the population?
- It is clearly too tolerant
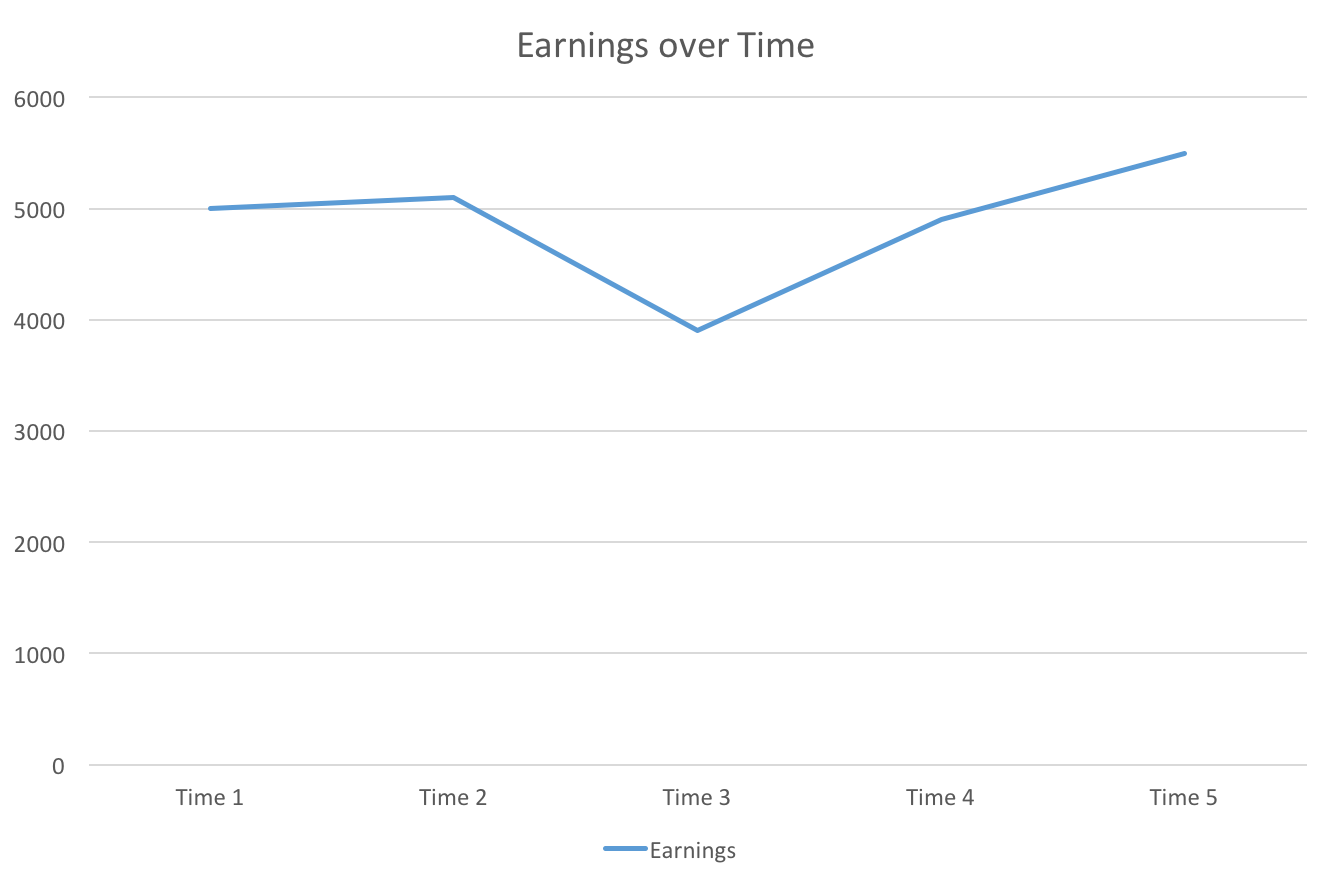
Noisy Data
- Obvious solution: use more data!
- Mobility
- This classification is too strict
- The ideal index minimizes misclassification while being tolerant enough to be robust to small exogenous income changes
Multidimensional Indices
Mobility with Respect to What?
- In multiperiod data, what rank do we evaluate mobility with respect to?
- Let $R_i$ denote this reference rank for individual $i$
- Unless there is an apriori reason to prefer a rank, use the mode
- Example: Look at individuals who joined a program thought to affect earnings at year $t$. Then $t$ ought to the be year we talk about mobility in reference to
Tolerance
- Let $\alpha$ be the tolerance parameter and $r_{it}$ be the rank of individual $i$ at time $t$
- An individual experiences mobility if $\sum_{t=1}^{N} |r_{it} - R_i| > \alpha$
- Geometrically, this is a distance to the diagonal and we can think of the set of ranks $D_\alpha = \{ r_i \mid \sum_{t=1}^{N} |r_{it} - R_i| \leq \alpha \} $ as the generalized diagonal
- Observe that the Prais-Bibby Index for arrays assumes $\alpha = 0$
Generalized Diagonal Index
- Define the Generalized Diagonal index as follows: $$m_{gd}(M_{u}) = 1 - \left( \sum_{p \in D_\alpha(M_{u})} p \right)$$
- Interpretation: probability that one is not on the Generalized Diagonal at tolerance $\alpha$
Setting Tolerance Threshold
- $\alpha < \frac{N}{2}$
- If one does not experience mobility, then one should be in the reference rank for a majority of the observations
- $\alpha$ is non-decreasing in $N$
- As the number of observed times increases, the tolerance threshold should never decrease
Recap
- Noisy data is problematic for multiperiod mobility measurement
- Developed the notion of tolerance to generalize the Prais-Bibby index on arrays
Empirical Analysis
Data
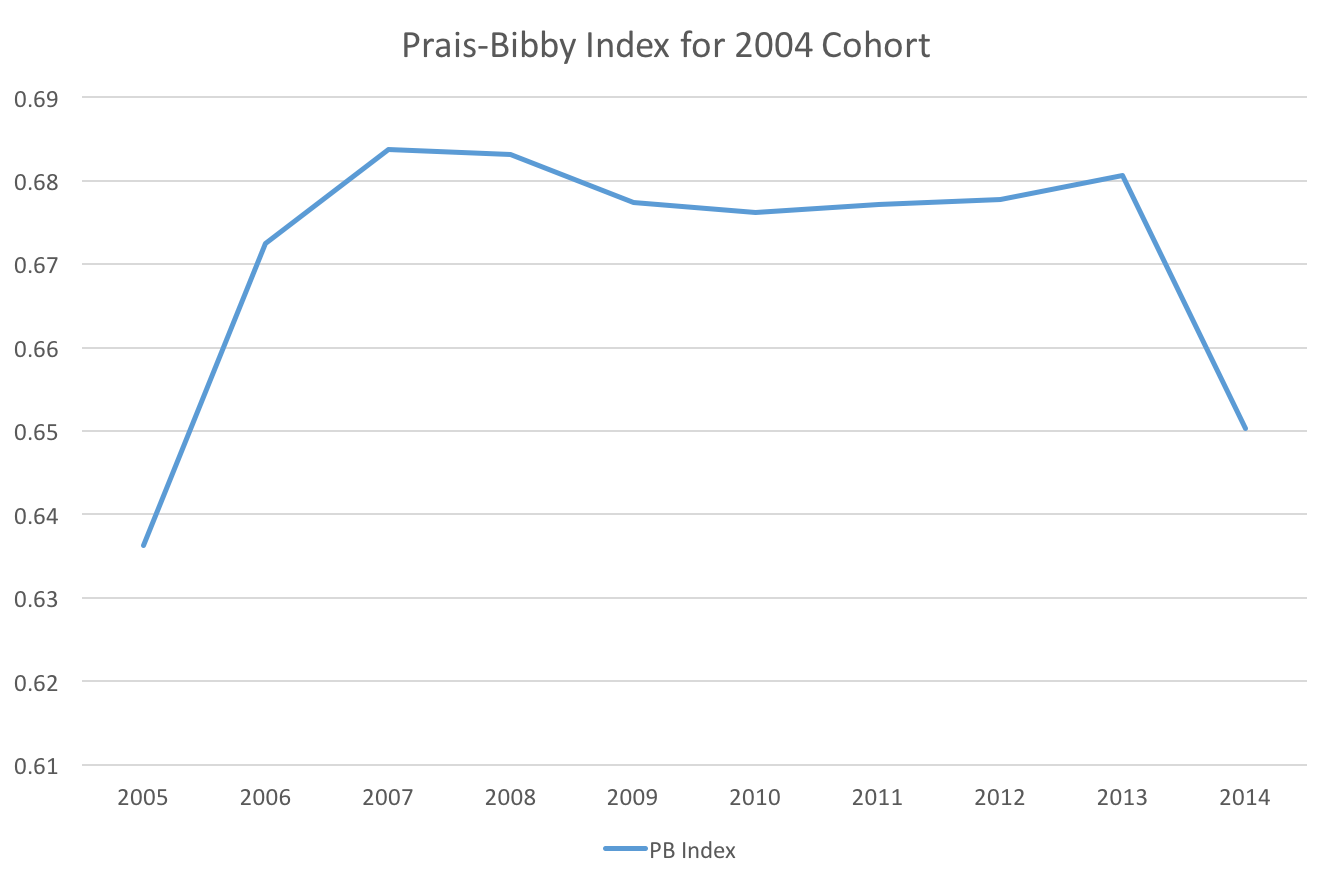
- Earnings data for enrollees in SNAP in Georgia during 2004
- Date range: 2004-2014
- Obtained by merging SNAP enrollment data to DOL annual wage data
Results
- From 2006 to 2013, the Prais-Bibby index appears relatively stable
- By selecting any of these years, one may conclude that approx. 68% of the cohort experiences mobility
- This potentially includes misclassifications (additionally due to data quality issues)
Results
- The PB Index for arrays suggests that the PB index alone underestimates mobility
- However, it likely overestimates mobility
- The GD Index finds a middle ground
- PB Index for Arrays: to 2009
- 0.79
- PB Index for Arrays: to 2014
- 0.81
- GD Index: to 2009
- 0.77
- GD Index: to 2014
- 0.75
Conclusions
- Noisy data is problematic for multiperiod mobility measurement
- Developed the notion of tolerance to generalize the Prais-Bibby index on arrays
- Observed improvements in inferring the mobility of a population of SNAP recipients
Future Directions
- Explore the Generalized Diagonal index from the perspective of contingency tables
- Consider which sets of mobility axioms are satisfied by the Generalized Diagonal index
- Derive statistical properties of the Generalized Diagonal Index
Example